Bias and Variance
· 3 min read
偏差 (Bias)
info
其中, 表示期望, 是真实值, 是模型对给定输入 的预测
偏差衡量了模型预测的平均误差。高偏差可能意味着模型过于简单(即模型欠拟合),无法捕获数据中的所有相关性,导致预测结果偏离真实值。
import numpy as np
import matplotlib.pyplot as plt
from sklearn.linear_model import LinearRegression

np.random.seed(0)

x = np.linspace(-10, 10, 10)

print("Input: ", y)

def f(x):
    return 2 * x + 3

y = f(x) + np.random.normal(0, 2, size=len(x))  # 添加噪声

model = LinearRegression()
model.fit(x.reshape(-1, 1), y)

y_pred = model.predict(x.reshape(-1, 1))

bias = np.mean(y_pred - f(x))

print("True value: ", y)
print("Predicted value: ", y_pred)
print("Bias: ", bias)

plt.scatter(x, y, color='blue', label='True value')
plt.plot(x, y_pred, color='red', label='Predicted value')
plt.legend()
plt.show()
方差 (Variance)
在概率论中,方差是一个衡量预测值分散程度的量。
在机器学习中,通常将方差定义为使用不同的训练数据集训练出的模型对相同的输入值 的预测的差异。方差的数学定义是
在这个公式中,最外的期望 是对不同的训练数据来说的,对于单个数据集是无意义的。
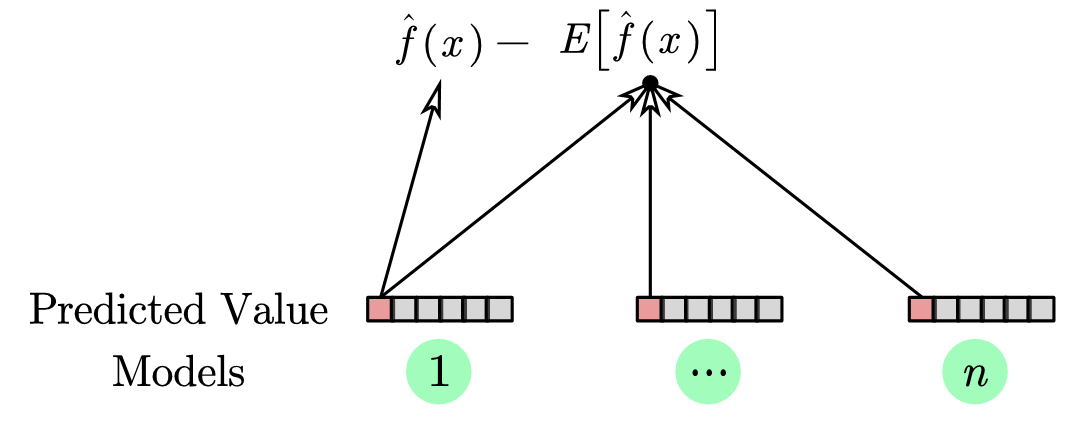
这里内侧的 是多个模型对于同一个输入 的预测值的期望
如下图所示
 又可以说是代表了这个模型训练能够得到的稳定的平均水平
同样的代码示例:
import numpy as np
import matplotlib.pyplot as plt
from sklearn.linear_model import LinearRegression

np.random.seed(0)

x = np.linspace(-10, 10, 10)

def f(x):
    return 2 * x + 3

y_true = f(x)

predictions = []

for _ in range(100):
    y = y_true + np.random.normal(0, 1, size=len(x))

    model = LinearRegression()
    model.fit(x.reshape(-1, 1), y)

    y_pred = model.predict(x.reshape(-1, 1))
    predictions.append(y_pred)

variance = np.var(predictions, axis=0)
print("Variance: ", variance)
plt.figure(figsize=(10, 6))
plt.plot(x, y_true, color='black', label='True function')
for i, y_pred in enumerate(predictions):
    plt.plot(x, y_pred, color='blue', alpha=0.1)
plt.legend()
plt.show()
降低泛化误差方法 (正则化方法)
- dropout
- dense 中的 normalization
- 数据中的 shuffle
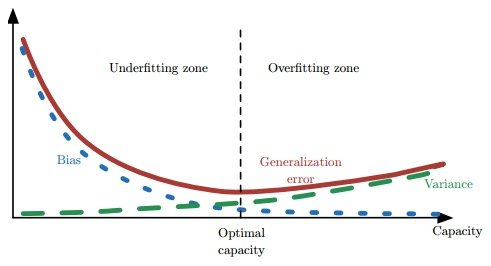
方差、偏差和模型复杂度之间的关系

